In this tutorial, we are going to learn about linear regression and its implementation.
What is Linear Regression?
Linear regression is one of the simplest and most important machine learning algorithms. It predicts continuous values (e.g., house prices, temperatures, sales revenue). It deals with numerical outputs. So, it is a supervised learning algorithm specifically used for regression tasks
Theoretical Explanation
Equation
Linear regression is a statistical method used to model the relationship between a dependent variable (target) and one or more independent variables (features). It assumes that this relationship can be described using a straight line.
y = wx + b
Here,
- y is the dependent variable
- x is the independent variable
- w is the weight(slop of the line)
- b is the bias( y-intercept point)
The goal of Linear Regression
The goal of linear regression is to estimate the parameters w and b such that the line minimizes the difference between the actual data points and the prediction made by the line
Cost Function
Mean Squared Error (MSE): The average squared difference between the actual and predicted values.
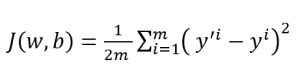
Let assume,
- m is the number of training example
- (x^i ,y^i ) is i-th training example
- y’ is the predicted value
- y is the actual value
Practical Implications
Let’s implement linear regression using Python’s Scikit-learn. For implementation, we will follow these steps:
Step 1: Importing libraries
First, we need to import the required Python libraries. We will be using NumPy, Matplotlib, and Scikit-Learn.
- NumPy for numerical operations
- Matplotlib for plotting
- Scikit-learn for building our model
import numpy as np
import matplotlib.pyplot as plt
from sklearn.model_selection import train_test_split
from sklearn.linear_model import LinearRegression
from sklearn.metrics import mean_squared_error
Step 2: Loading the Dataset
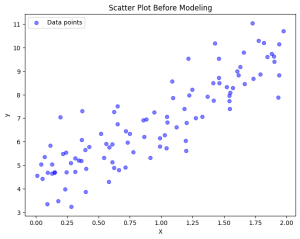
In this example, we will generate a dataset. This dataset will simulate a simple relationship between x and .
np.random.seed(42)
X = 2 * np.random.rand(100, 1)
y = 2 + 6 * X + np.random.randn(50, 1)

plt.figure(figsize=(8, 6))
plt.scatter(X, y, color='blue', alpha=0.5, label='Data points')
plt.xlabel('X')
plt.ylabel('y')
plt.title('Scatter Plot Before Modeling')
plt.legend()
plt.show()
Output :
Step 3: Splitting the Data
Now, we will split the dataset into training and testing sets. The training set is used to fit the model. The test set is used to evaluate its performance.
X_train, X_test, y_train, y_test = train_test_split(X, y, test_size=0.2, random_state=42)
Step 4: Training the model
Now, we’ll create an instance of the LinearRegression() model and fit it into our training data
model = LinearRegression()
model.fit(X_train, y_train)
Step 5: Making Predictions
Now our model is trained and we can predict y value for our test set.
y_pred = model.predict(X_test)
Step 6: Evaluate Model
Now we have to check how precisely our model is working. For that, we have to check its bias and weight as well as the Mean Squared Error. Here we can Mean Squared Error is near 0.653 so it indicates that our model fits the data well with minimal error.
print(f'Bias: {model.intercept_[0]}')
print(f'Weight: {model.coef_[0][0]}')

mse = mean_squared_error(y_test, y_pred)
print(f'Mean Squared Error: {mse}')
Output :
Bias: 4.142913319458566
Weight: 2.7993236574802762
Mean Squared Error: 0.6536995137170021
Step 7: Visualizing the Results
Finally, we have completed all the steps and now we can visualize the plot of the test data along with the regression line.
plt.figure(figsize=(8, 6))
plt.scatter(X_test, y_test, color='blue', alpha=0.5, label='Actual values')
plt.plot(X_test, y_pred, color='red', linewidth=2, label='Regression Line')
plt.xlabel('X')
plt.ylabel('y')
plt.title('Linear Regression Model Fit')
plt.legend()
plt.show()
Output:

Conclusion
In this tutorial, we learned the basics of linear regression, including its theoretical foundation and practical implementation using Scikit-learn. We have demonstrated how to train a model, make predictions, and evaluate its performance using the Mean Squared Error metric.
For more reference, you can visit: Implementing Linear Regression from Scratch in Python