Have you ever wondered how companies analyze large amounts of data – like total sales per region or average performance of students per class? One of the most powerful tool for this in python is Pandas.
In this tutorial, I’ll walk you through how to group and aggregate data using pandas in a simple and practical way.
What are we building?
We’re going to build a small program that groups data and then aggregates it , meaning we will calculate totals ,averages ,and other summary statistics per group.
Think of it like having a digital assistant that takes your raw table and quickly answers questions like:
- “what’s the total number of rides for each driver?”
- “what’s the average earning per ride?”
How does it work?
We’ll use pandas ,the go-to data analysis library in Python. Pandas has function called .groupby() that allows us to group data by any column- like names, dates ,or categories.
Once grouped , we’ll apply aggregation functions such as:
- .sum() – to add values
- .mean() – to get averages
- .count() – to count rows
It’s like turning a messy spreadsheet into a clean summary table instantly.
Now let us take an example of a scenario where a taxi company wants to evaluate driver performance over a week. You have data as follows:
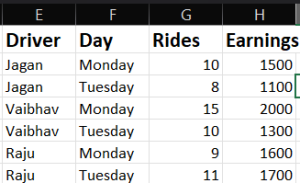
We have to group this data and aggregate to calculate total earnings and average earnings per ride.
The Process – Step by Step
- Import pandas library – It is used for data manipulation
import pandas as pd
- 2.Create the data frame
data = {
'Driver':['Jagan', 'Jagan', 'Vaibhav', 'Vaibhav', 'Raju', 'Raju'],
 'Day':['Monday', 'Tuesday', 'Monday', 'Tuesday', 'Monday', 'Tuesday'],
'Rides':[10,8,15,10,9,11],
'Earnings':[1500,1100,2000,1300,1600,1700]
}
df = pd.DataFrame(data)
- – We define dictionary data with 4 keys – Driver, Day, Rides, Earnings .
- – pd.DataFrame(data) converts this dictionary into a DataFrame(table).
- 3. Group and Aggregate
result = df.groupby('Driver').agg({
    'Rides': 'sum',
    'Earnings': 'sum'
}).reset_index()
– df.groupby(‘Driver’) : groups the rows based on each unique rider
– .agg({…..}) : applies aggregation function
– ‘Rides’ : ‘sum’ : total number of rides per driver
– ‘Earnings’ : ‘sum’ : total earnings per driver
– .reset_index() : converts the grouped “Driver” from an index back to a column
4.Add new aggregated column
result['Avg_Earnings_Per_Ride'] = result['Earnings'] / result['Rides']
– We calculate average earnings per ride for each driver
– Tis adds a new column to the result
5.Print final output
print(result)
Output
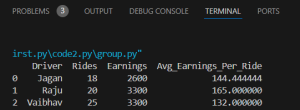
Now we have the grouped and aggregated data of the data given to us .