Visualization is a powerful way to convey information. In this tutorial, we’ll walk through creating a dynamic pie chart using Chart.js, where the user can input data, and the chart will be updated accordingly.
Step-by-step guide
1. Set Up Your Project Structure
Create a project directory with three files: index.html, styles.css, and script.js. Your project directory should look like this:
/pie-chart
    /index.html
    /styles.css
    /script.js
2. Create the HTML Structure
In your index.html file, set up the basic HTML structure, including a form for user input and a canvas element for Chart.js to place piechart.
<!DOCTYPE html>
<html lang="en">
<head>
    <meta charset="UTF-8">
    <meta name="viewport" content="width=device-width, initial-scale=1.0">
    <title>Dynamic Pie Chart with Chart.js</title>
    <link rel="stylesheet" href="styles.css">
    <script src="https://cdn.jsdelivr.net/npm/chart.js"></script>
</head>
<body>
    <h1>Pie Chart</h1>
    <div class="container">
        <form id="dataForm">
            <label for="labels">Labels (comma separated): </label>
            <input type="text" id="labels" name="labels" required>
            <br><br>
            <label for="data">values (comma separated): </label>
            <input type="text" id="data" name="data" required>
            <br><br>
            <button type="submit">Update Chart</button>
        </form>
        <div class="chartContainer">
            <canvas id="pieChart" width="400" height="400"></canvas>
        </div>
    </div>


    <script src="script.js"></script>
</body>
</html>
3. Adding styles to the page
Style your form and layout by adding the following CSS to styles.css:
body {
    font-family: Arial, sans-serif;
    text-align: center;
    margin-top: 50px;
}

form {
    margin-bottom: 20px;
}

label {
    font-weight: bold;
}

input {
    margin-bottom: 10px;
}

button {
    padding: 10px 20px;
    font-size: 16px;
    cursor: pointer;
    border-radius: 10px;
    border-style: none;
    box-shadow: rgba(0, 0, 0, 0.15) 1.95px 1.95px 2.6px;
    font-weight: bolder;
}

button:hover{
    background-color:aliceblue ;
}

#dataForm{
    margin: auto 0;
    border-radius: 10px;
    box-shadow: rgba(0, 0, 0, 0.35) 0px 5px 15px;
    padding: 3rem;
}

.container{
    display: grid;
    grid-template-columns: 1fr 1fr;
    gap: 3rem;
    padding: 3rem;
}

.chartContainer {
    height: 30rem;
}
4. Add the JavaScript Logic
Now we will write the logic to handle form submissions, update the chart data, and generate random colors for the chart segments in script.js
const ctx = document.getElementById('pieChart');
const pieChart = new Chart(ctx, {
    type: 'pie',
    data: {
        labels: [],
        datasets: [{
            data: [],
            backgroundColor: []
        }]
    }
});

function getRandomColor() {
    const letters = '0123456789ABCDEF';
    let color = '#';
    for (let i = 0; i < 6; i++) {
        color += letters[Math.floor(Math.random() * 16)];
    }

    return color;
}


document.getElementById('dataForm').addEventListener('submit', function(event) {
    event.preventDefault();
    const labels = document.getElementById('labels').value.split(',').map(label => label.trim());
    const data = document.getElementById('data').value.split(',').map(value => parseFloat(value.trim()));

    const backgroundColors = data.map(() => getRandomColor());

    pieChart.data.labels = labels;
    pieChart.data.datasets[0].data = data;
    pieChart.data.datasets[0].backgroundColor = backgroundColors;
    pieChart.update();
});
Explanation of the JavaScript Code:
- Random Color Generation: The
getRandomColorfunction generates a random hex color code, which will be used to color the pie chart segments. - Initialize the Chart: We initialize the Chart.js pie chart with empty data. This setup includes specifying the chart type and data structure.
- Form Submission Handler: This function handles form submissions, processes the user inputs, generates random colors, updates the chart data, and re-renders the chart.
Conclusion:
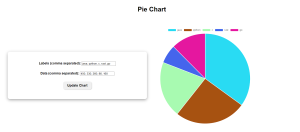
All the above steps are essential for creating a pie chart with Chart.js. If you have followed the steps properly you should have a working web app ready with you now, Here’s a picture of the final result for reference.
Learn more :
Randomize elements in a JavaScript array
DOM Events using JavaScript?
Chart.js official docs