Hey there, data enthusiasts! Ever wondered how to group similar data points together automatically? That’s exactly what K-Means Clustering does! It’s one of the most popular clustering algorithms in machine learning. In this post, we’ll break it down step by step and implement K-Means clustering using SciPy in Python. Let’s dive in!
K-Means Clustering with SciPy in Python
What is K-Means Clustering?
K-Means is an unsupervised learning algorithm used to group data into K clusters. It works by:
- Choosing K cluster centers (randomly or using an algorithm).
- Assigning each data point to the nearest cluster.
- Updating the cluster centers based on the assigned points.
- Repeating the process until convergence (when cluster centers stop changing).
Why Use SciPy for K-Means?
While scikit-learn provides an implementation for K-Means, SciPy has a lightweight version that’s great for quick clustering tasks. It’s useful when you don’t need all the extra features of scikit-learn but still want a powerful clustering solution.
Step 1: Import Necessary Libraries
Let’s start by importing the required libraries.
import numpy as np
import matplotlib.pyplot as plt
from scipy.cluster.vq import kmeans, vq
- NumPy: For numerical operations.
- Matplotlib: To visualize clusters.
- SciPy’s
kmeans andvq: For clustering and assigning data points to clusters
Step 2: Generate Sample Data
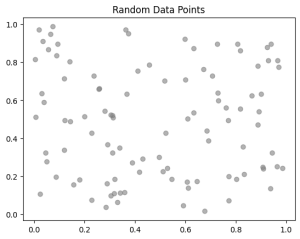
We’ll create a dataset with random points to demonstrate clustering.
# Generate random data points
np.random.seed(42)
data = np.random.rand(100, 2)  # 100 points in 2D space

# Visualize the data
plt.scatter(data[:, 0], data[:, 1], c='gray', alpha=0.6)
plt.title("Random Data Points")
plt.show()
Step 3: Apply K-Means Clustering
Now, let’s apply K-Means clustering using SciPy.
# Define number of clusters (K)
K = 3

# Perform K-Means clustering
centroids, _ = kmeans(data, K)

# Assign each point to a cluster
cluster_labels, _ = vq(data, centroids)
kmeans(data, K): Finds K cluster centers.vq(data, centroids): Assigns each point to the nearest cluster.
Step 4: Visualize the Clusters
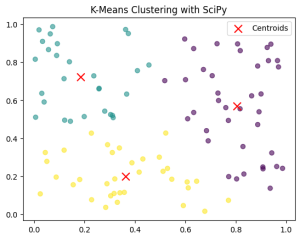
Let’s plot the clusters with different colors and mark the cluster centers.
# Scatter plot with clusters
plt.scatter(data[:, 0], data[:, 1], c=cluster_labels, cmap='viridis', alpha=0.6)
plt.scatter(centroids[:, 0], centroids[:, 1], c='red', marker='x', s=100, label='Centroids')
plt.title("K-Means Clustering with SciPy")
plt.legend()
plt.show()
This will display the clustered points with their respective centroids (marked in red).
Step 5: Choosing the Right K
Selecting the right number of clusters (K) is important! A common technique is the Elbow Method, which involves:
- Running K-Means for different values of K.
- Calculating the distortion (sum of squared distances from each point to its assigned center).
- Plotting the distortion vs. K and choosing the “elbow” point (where the decrease slows down).
distortions = []
K_range = range(1, 10)
for k in K_range:
    centroids, distortion = kmeans(data, k)
    distortions.append(distortion)

# Plot elbow curve
plt.plot(K_range, distortions, marker='o')
plt.xlabel("Number of Clusters (K)")
plt.ylabel("Distortion")
plt.title("Elbow Method for Optimal K")
plt.show()
The ideal K is usually where the curve forms an “elbow”.

Conclusion
And there you have it! 🎉You’ve just learned how to perform K-Means clustering using SciPy in Python. Whether you’re clustering customer data, segmenting images, or analyzing trends, K-Means is a powerful tool.
Now it’s your turn! Try clustering your own datasets and experiment with different values of K. Happy coding!
Got questions or cool clustering projects? Drop them in the comments below!