In this tutorial, we are going to learn and understand k-means clustering
What is K- Means Clustering?
It is one of the widely used unsupervised learning algorithms. It is used to group unlabeled data in K- number of distinct clusters. So that every data in the same cluster has the same property. The objective is to group data points so that data points within the same cluster are more similar to each other than to those in other clusters.
Key Characteristics
- K (Number of Clusters): It is a user-defined parameter. It is important to define proper K.
- It is important to choose of initial centroid, the result may differ with the wrong choice.
Elbow Method
The elbow method is a technique used to determine the proper number of clusters K. In this method, we plot the WCSS(within-cluster sum of squares) or inertia against values of K. The ‘elbow’ point is where the rate of decrease in the graph slows down. This point represents the number of clusters.
Implementing K- Means Clustering in Python
Let’s implement K- Means Clustering using Python. For implementation, we will follow these steps:
Step 1:Import Required Libraries
First, we need to import the required Python libraries. We will be using Pandas, Matplotlib, and Scikit-Learn, for data handling, visualization, and clustering.
import pandas as pd
import seaborn as sns
import matplotlib.pyplot as plt
from sklearn.cluster import KMeans
Step 2: Import the Dataset
We will use the Salary Dataset for this Tutorial. You can visit the dataset: Salary.csv
df = pd.read_csv("salary.csv")
df.head()
Step 3: Visualize the Data
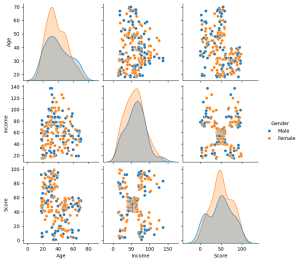
We will visualize a pair plot. A pair plot helps us analyze relationships between multiple features
sns.pairplot(df[['Age', 'Income', 'Score', 'Gender']], hue='Gender')
plt.show()
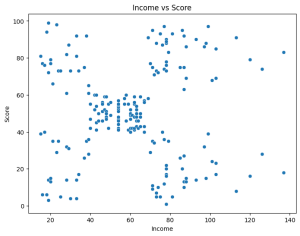
To better understand, we visualize the relationship between Income and Score
plt.figure(figsize=(8, 6))
sns.scatterplot(x=df['Income'], y=df['Score'])
plt.xlabel('Income')
plt.ylabel('Score')
plt.title('Income vs Score')
plt.show()
Step 4: Find K for K- Means Clustering
Before clustering, we determine the optimal number of clusters using the Elbow Method.
X = df[['Income', 'Score']]

inertia = []
for k in range(1, 11):
    kmeans = KMeans(n_clusters=k, random_state=42)
    kmeans.fit(X)
    inertia.append(kmeans.inertia_)

plt.figure(figsize=(8, 4))
plt.plot(range(1, 11), inertia, marker='o')
plt.xlabel('Number of Clusters')
plt.ylabel('Inertia')
plt.title('Elbow Method for Clustering')
plt.show()

Step 5:Visualize the Cluster
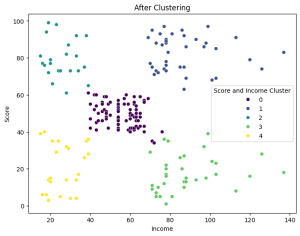
We now apply clustering with 5 clusters
kmeans = KMeans(n_clusters=5, random_state=42)
df['Score and Income Cluster'] = kmeans.fit_predict(X)
df.head()
plt.figure(figsize=(8, 6))
sns.scatterplot(x=df['Income'], y=df['Score'], hue=df['Score and Income Cluster'], palette='viridis')
plt.xlabel('Income')
plt.ylabel('Score')
plt.title('After Clustering')
plt.show()