To create a more comprehensive SIP (Systematic Investment Plan) calculator web application, we’ll enhance the previous example by adding more features, including graphical representation using Chart.js for better visualization. This SIP calculator web application provides a user-friendly interface for calculating and visualizing SIP investments. You can further enhance it by adding features like different compounding frequencies, inflation adjustment, more advanced chart configurations, and error handling for edge cases.
CREATE A SIP CALCULATOR WEB APPLICATION
Here’s how you can implement it step-by-step:
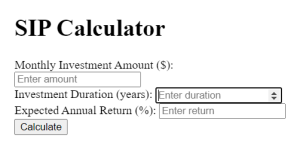
- HTML: Defines the structure of the SIP calculator with input fields for monthly investment amount, investment duration, and expected annual return. Results are displayed in a container below the inputs, and a Chart.js canvas is provided for graphical representation.
- CSS: Styles the calculator and ensures it’s responsive and visually appealling.
- JavaScript(script.js): Calculate Function: Handles the core functionally of the calculator. It calculates the future value of SIP investments based on user inputs the compound interest formula. Chart.js Integration: Uses Chart.js to create a line chart that visualizes the growth of investments over the investments period.
USAGE:
- Input fields: Enter the desired monthly investment amount, investment duration in years, and expected annual return rate.
- Calculate button: Click the “calculate” button to compute the estimated future value of your SIP investment and display results.
- Results display: The calculated results (including inputs and estimated future value) will be shown in the results container below the inputs. Additionally, a line chart will display the growth of investments over time.
code:
<!DOCTYPE html>
<html lang="en">
<head>
    <meta charset="UTF-8">
    <meta name="viewport" content="width=device-width, initial-scale=1.0">
    <title>SIP Calculator</title>
    <link rel="stylesheet" href="styles.css">
</head>
<body>
    <div class="container">
        <h1>SIP Calculator</h1>
        <div class="input-container">
            <label for="investmentAmount">Monthly Investment Amount ($):</label>
            <input type="number" id="investmentAmount" placeholder="Enter amount" required>
        </div>
        <div class="input-container">
            <label for="investmentDuration">Investment Duration (years):</label>
            <input type="number" id="investmentDuration" placeholder="Enter duration" required>
        </div>
        <div class="input-container">
            <label for="expectedReturn">Expected Annual Return (%):</label>
            <input type="number" id="expectedReturn" step="0.01" placeholder="Enter return" required>
        </div>
        <button onclick="calculate()">Calculate</button>
        <div id="results" class="results-container">
            <!-- Results will be displayed here -->
        </div>
        <div class="chart-container">
            <canvas id="myChart"></canvas>
        </div>
    </div>

    <script src="https://cdn.jsdelivr.net/npm/chart.js"></script>
    <script src="script.js"></script>
</body>
</html>
body {
    font-family: Arial, sans-serif;
    background-color: #f0f0f0;
    display: flex;
    justify-content: center;
    align-items: center;
    height: 100vh;
}

.container {
    width: 80%;
    max-width: 600px;
    background-color: #fff;
    padding: 20px;
    border-radius: 8px;
    box-shadow: 0 0 10px rgba(0, 0, 0, 0.1);
}

.input-container {
    margin-bottom: 10px;
}

input[type="number"] {
    width: 100%;
    padding: 8px;
    border: 1px solid #ccc;
    border-radius: 4px;
}

button {
    display: block;
    width: 100%;
    padding: 10px;
    background-color: #007bff;
    color: #fff;
    border: none;
    border-radius: 4px;
    cursor: pointer;
    font-size: 16px;
}

button:hover {
    background-color: #0056b3;
}

.results-container {
    margin-top: 20px;
    padding: 10px;
    background-color: #f0f0f0;
    border: 1px solid #ccc;
    border-radius: 4px;
}

.chart-container {
    margin-top: 20px;
}
let myChart;

function calculate() {
    // Get user inputs
    let investmentAmount = parseFloat(document.getElementById('investmentAmount').value);
    let investmentDuration = parseInt(document.getElementById('investmentDuration').value);
    let expectedReturn = parseFloat(document.getElementById('expectedReturn').value);

    // Validate inputs
    if (isNaN(investmentAmount) || isNaN(investmentDuration) || isNaN(expectedReturn)) {
        alert('Please enter valid numbers for all fields.');
        return;
    }

    // Clear previous chart if exists
    if (myChart) {
        myChart.destroy();
    }

    // Calculate SIP
    let monthlyRate = expectedReturn / 100 / 12;
    let totalMonths = investmentDuration * 12;
    let futureValue = 0;
    let dataPoints = [];

    for (let i = 1; i <= totalMonths; i++) {
        futureValue += investmentAmount;
        futureValue *= (1 + monthlyRate);
        dataPoints.push({ x: i, y: futureValue });
    }

    // Display results
    let resultsContainer = document.getElementById('results');
    resultsContainer.innerHTML = `
        <h2>Results</h2>
        <p>Monthly Investment Amount: $${investmentAmount.toFixed(2)}</p>
        <p>Investment Duration: ${investmentDuration} years</p>
        <p>Expected Annual Return: ${expectedReturn}%</p>
        <p>Estimated Future Value: $${futureValue.toFixed(2)}</p>
    `;

    // Draw Chart
    let ctx = document.getElementById('myChart').getContext('2d');
    myChart = new Chart(ctx, {
        type: 'line',
        data: {
            datasets: [{
                label: 'SIP Growth',
                data: dataPoints,
                borderColor: '#007bff',
                fill: false
            }]
        },
        options: {
            scales: {
                xAxes: [{
                    type: 'linear',
                    position: 'bottom'
                }]
            }
        }
    });
}
OUTPUT: