The exciting field of Machine Learning enables computers to gain knowledge from data and make wise decisions. Supervised and unsupervised learning are the two main categories at the core of machine learning. Both offer distinct applications and applications and approaches that address various problem types. We’ll go into great detail about these two learning paradigms in this blog spot, outlining their functions and common applications.
What is Supervised Learning?
This is a kind of machine learning algorithm that is trained on labeled data. This indicates that the input and the matching correct output those are included in the training data. The aim of supervised learning is learning a mapping from the input to the output to provide accurate output prediction for any unseen inputs.
How Supervised Learning Work?
- Training Phase: The algorithm receives an input-output pair dataset. For instance, the email content would be the inputs, and the labels “spam” or “not spam” would be the outputs in a dataset used to identify emails as spam or not spam.
- Learning Phase: Using the training data, the algorithm learns how to map inputs to outputs, for the most part, minimizing the error between the predicted and actual outputs.
- Prediction: After training, The model can predict the result for fresh inputs after it has been trained. For example, based on what it has learned, it can identify whether a new email is spam or not.
Key points:
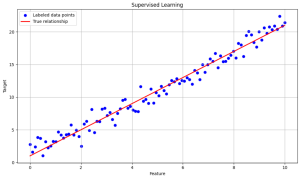
- The plot shows a collection of blue dots. Each dot represents an input data point that has both a feature (X-Axis) and a target value (Y-Axis) these points are called labeled data points because each one has an associated target value or label with which a model is trained.
- The red line represents the true relationship or the pattern between the feature and target that the model is trying to learn which is an approximation line obtained from the labeled data points that we can see around the line. Therefore the red line or true relationship or approximated line is used to predict any unseen data or new data.
- This visualization demonstrated how supervised learning models we use labeled data to make predictions.
Common Algorithms in Supervised Learning
- Linear Regression: This method predicts continuous quantities, such as home prices. For example, determining the coefficients that best fit the training data is necessary to predict property values based on attributes like size, location, and number of bedrooms, linear regression is straightforward but efficient for many real-world situations since it presumes a linear relationship between the variables.
- Logistic Regression: This method predicts binary outcomes like spam/not spam. It outputs probability values between 0 and 1 by applying a logistic function to a linear regression equation. It is used for classification problems with two classes.
- Decision Trees: They are employed in problems involving regression and classification. Decision trees provide a tree-like model of decisions by dividing the data into subsets according to the input feature values. Every node in the tree denotes a choice made in response to a feature’s value, and every branch shows how that choice turned out. The decision or finished product is represented by the leaves. For instance, a decision tree can assist in making a diagnosis based on the symptoms a patient experiences. The decision tree’s branches correspond to many probable diagnoses, and each node represents a query regarding a symptom.
- Support Vector Machines (SVM): SVMs are discriminative classifiers that find the optimal hyperplane separating classes with maximum margin. SVMs excel with high-dimensional data and when there are more dimensions than samples. The hyperplane is positioned using the closest data points called support vectors.
- Neural Networks: These networks are multi-layered networks inspired by biological neurons. During training, connection weights are adjusted to minimize errors in training data. Neural nets can learn hierarchical representations, making them powerful for complex high-dimensional tasks like image and speech recognition. However, they require large training datasets.
Example using a Linear Regression model
 Key points:
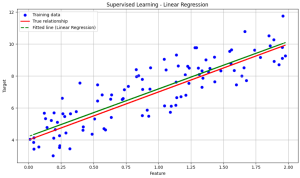
- The green dashed line is the linear regression model’s fitted line. This line represents the
relationship the model has learned from the training data. The model tried to approximate the true relationship or the approximated line or the red line, by minimizing the difference between the predicted and actual target values. - The better the model is trained, the closer this fitted line will be to the true relationship the red line, or the approximated line.
- Therefore, this fitted line (green dashed or linear regression line) is used to predict unseen data or new data.
Applications of Supervised Learning
- Email spam detection: Determining whether an email is spam or not. Models like Neural networks and logistic regression are examples of supervised learning models that are trained on a dataset or labeled emails (spam or not spam). The algorithm can accurately predict whether incoming emails are spam or not by learning to identify patterns that are suggestive of spam, using features like metadata, the frequency of specific terms, and the existence of links.
- Classification of Images: Recognizing items in pictures (like identifying cats in pictures). Convolutional neural networks (CNNs), in particular, are very good at image classification tasks when using supervised learning. A CNN learns to recognize features like edges, textures, and forms by being trained on a large dataset of labeled images. The network can recognize complex objects like faces, animals, and everyday objects mainly due to this hierarchical learning. Applications include medical imaging analysis and facial recognition software.
- Medical diagnosis: Making illness or disease predictions using patient information. Supervised learning models train on patient records and diagnostic results. Features include symptoms, test findings, and demographic data. The models gain the ability to predict diagnoses for new patients by learning to link these properties to certain diseases. Applications range from estimating the chance of a patient getting a disorder based on historical data to recognizing diseases based on imaging data.
- Fraud Detection: Recognising fraudulent financial services transactions and their patterns for fraud prevention. Supervised learning models are trained using transaction history classified as either authentic or fraudulent. The models learn to recognize patterns linked to fraud using features like transaction amount, time, location, and user behavior. The model can detect and suspect transactions as potentially fraudulent in real-time. Credit card companies, banks, and e-commerce platforms need to do this to guard against monetary losses and security breaches.
What is Unsupervised Learning?
Conversely, unsupervised learning works with unlabeled data. Finding buried patterns or essential structures in the raw data is the aim here. In contrast to supervised learning, there are no output labels to direct the learning process. Instead, the algorithm attempts to learn the underlying structure of the data on its own. Unsupervised learning is often used for exploratory data analysis, dimensionality reduction, and clustering tasks.
How Does Unsupervised Learning Work?
- Data Exploration: The algorithm receives an unlabeled dataset. The algorithm doesn’t have any predefined labels to help with, instead, it must explore the data to identify patterns and structures on its own. This initial stage is crucial for understanding the basic properties and distribution within the dataset.
- Pattern discovery: The algorithm looks at the data to determine the underlying structure. This could involve clustering( putting related data points together), and dimensionality reduction( lowering the number of dimensions while preserving most features in the data to make it easier to handle).
 Key points:
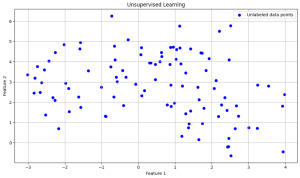
- The blue dots represent data points with inputs (features) but no outputs (targets). These are the raw data points used for finding patterns. So here are only two features or data points represented on the x-axis and y-axis but there are no target labels associated with these points.
- The goal of unsupervised learning is to analyze these data points or features to identify any natural group patterns or clusters within the data. Algorithms like K-Means clustering and Principal component analysis are commonly used for this purpose.
Common Algorithms in Unsupervised Learning
- K-Means Clustering: This algorithm assigns a predetermined number of clusters to the data. It is mainly used in market segmentation, image compression, and anomaly detection.
- Hierarchical Clustering: This method creates a cluster hierarchy. It builds a tree of clusters either by merging small clusters into larger ones or vice versa.
- Principal Component Analysis (PCA): PCA reduces data dimensionality. PCA finds the directions in which the data fluctuates the greatest, known as the principle components. PCA selects the main components that best capture the most important variance while reducing the number of dimensions by mapping data onto them. This helps with noise reduction, machine learning algorithm speeding, and visualizing high-dimensional data.
- Anamoly Detection: These methods find anomalous data points that deviate from the typical trend. anomaly detection finds anomalies in the data when data deviates from the expected pattern. These anomalies might indicate failed equipment, fraudulent transactions, or network attacks. Techniques include statistical methods, clustering-based methods, and more advanced methods like autoencoders in neural networks.
Example using K-Means
 Key points:
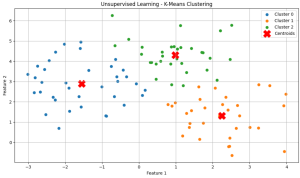
- The different colors of the data points represent the distinct clusters identified by the K-Means Algorithm. Each cluster groups together points that are similar to each other based on their features.
- The red ‘X’ symbols denote the centroids of the clusters, These centroids represent the central points of each cluster and are calculated as the mean of all data points in the respective clusters. These centroids provide a summary of the average location of points within a cluster.
- This algorithm effectively groups the data points into three clusters, This grouping helps in understanding the underlying structure and patterns in the data.
- This plot overall tells how unsupervised learning techniques can be used to analyze and organize data without predefined labels, making it a powerful tool for exploratory data analysis.
Applications of Unsupervised Learning
- Customer segmentation: Clustering algorithms put clients in groups according to how they buy. Retailers and marketers segment their consumer base according to demographics, tastes, and purchase patterns using this technique. This segmentation helps identify possible high-value clients, personalize customer experiences, and adjust marketing strategy.
- Market Basket Analysis: This technique finds products that are commonly purchased together. Algorithms analyze transaction data to find patterns of frequently purchased products together. The use of this data improves recommendation engines, cross-selling, and product placement. For instance, a story may discover that consumers who purchase bread also frequently purchase butter, resulting in the thoughtful arrangement of both products.
- Anomaly detection: This involves analyzing trends that may indicate fraud. Financial institutions use unsupervised learning to track transaction patterns and identify anomalies that may indicate fraud. This real-time identification improves security protocols and helps avoid large financial losses.
- Image compression: This technique reduces an image’s color palette to conserve storage space. One method is K-Means clustering which reduces an image’s color without compromising its key elements. The algorithm groups related colors and assigns each color a single value, decreasing the image file size which is advantageous for transmission and storage. This method is applied to JPEG formats.
Key Differences Between Supervised and Unsupervised Learning
- Data Labelling: Supervised learning uses labeled data, while unsupervised learning uses a dataset containing only the input features without any corresponding output labels or unlabeled data.
- Objective: Unsupervised learning seeks to identify patterns and structures within the data, whereas supervised learning aims to anticipate results or make predictions.
- Complexity: Because supervised learning deals with definite outcomes, it is typically simpler to understand and put into practice. The presence of labels provides a clear metric for evaluating the model’s performance, such as accuracy or mean squared error. Unsupervised learning can become more challenging when there are no clear evaluation metrics and no labeled data. The lack of labels means that there is no ground truth to directly measure the algorithm’s performance. Instead, evaluation often relies on indirect methods, such as the coherence of clusters or the variance explained by principal components.
Choosing Between Supervised and Unsupervised Learning
The problem at hand and the type of data at hand determine which of the two learning approaches-supervised or unsupervised- to choose. Supervised learning techniques require a clear prediction goal and labeled data. Unsupervised learning is more appropriate for examining data to find hidden patterns or groups.
Conclusion
Both supervised and unsupervised learning are effective techniques in the field of machine learning. Each has special advantages and used. Understanding when and how to apply these techniques is essential for building effective machine-learning models. Gaining proficiency in both will enable you to address a variety of issues and extract insights from your data will facilitate wise decision-making.
Understanding the principles of supervised and unsupervised learning is crucial, regardless of your level of experience with machine learning. You can investigate and use machine learning approaches to solve practical issues with this information.