In this tutorial, we will learn how to create a to-do list app with a pie chart in Tkinter to check the number of completed tasks. I hope you will find this helpful.
let’s understand the code with some simple steps:
Step 1: Importing some useful libraries
import tkinter as tk
from tkinter import messagebox
from matplotlib.backends.backend_tkagg import FigureCanvasTkAgg
import matplotlib.pyplot as plt
- Tkinter is used here to create GUI and provide various tools for windows, buttons, and other interface components.
- We use the matplotlib library for creating charts and graphs.
Step 2: Creating the main window
newWindow = tk.Tk()
newWindow.title("To-Do List")
newWindow.geometry("590x800+270+200")
newWindow.configure(bg="#0d1525")
- Tk() creates the main window.
- title() sets the window’s title.
- geometry() sets the window size and position.
- configure() sets the background color to a dark shade.
Step 3: For task completion
def mark_as_done(task_label, done_button):
    task_label.config(fg="gray", font=("Helvetica", 18, "overstrike"))
    done_button.config(state=tk.DISABLED, disabledforeground="green")
    update_task_count()
- mark_as_done() function updates the task label by crossing it out.
Step 4: To delete a task
def delete_task(task_frame):
    task_frame.destroy()
    update_serial_numbers()
    update_task_count()
- task_frame.destroy() removes the task’s frame from the window
- update_serial_numbers() renumbers the tasks after deletion.
- update_task_count() updates the task statistics.
Step 5: To Add a task
def add_task(task=None):
    task = task_entry.get().strip() if not task else task
    if not task:
        messagebox.showwarning("Empty Task", "Task cannot be empty.")
        return
task_frame = tk.Frame(task_container, bg="#1d2332", pady=5)
    task_number = len(task_container.winfo_children()) + 1
    task_label = tk.Label(task_frame, text=f"{task_number}. {task}", bg="#1d2332", fg="#ffffff", font=("Helvetica", 18))

 done_button = tk.Button(task_frame, text="Done", command=lambda: mark_as_done(task_label, done_button), bg="#add8e6", fg="#000000", font=("Helvetica", 12))
    delete_button = tk.Button(task_frame, text="Delete", command=lambda: delete_task(task_frame), bg="#ff6347", fg="#000000", font=("Helvetica", 12))

task_label.pack(side=tk.LEFT, padx=10)
    done_button.pack(side=tk.RIGHT, padx=5)
    delete_button.pack(side=tk.RIGHT, padx=5)
    task_frame.pack(fill=tk.X, pady=5)

    task_entry.delete(0, tk.END)
    update_serial_numbers()
    update_task_count()
- task_entry.get() fetches the task text that the user has typed.
- add_task() function lets a user add a new task.
Step 6: To update task numbers
def update_serial_numbers():
    for index, task_frame in enumerate(task_container.winfo_children()):
        task_label = task_frame.winfo_children()[0]
        task_text = task_label.cget("text").split(". ", 1)[1]
        task_label.config(text=f"{index + 1}. {task_text}")
- This function updates the number in sequence.
Step 7: to remove all tasks
def delete_all_tasks():
    for widget in task_container.winfo_children():
        widget.destroy()
    update_task_count()
- This function deletes all tasks at once.
Step 8: to update task statistics
def update_task_count():
    total_tasks = len(task_container.winfo_children())
    done_tasks = sum(1 for task_frame in task_container.winfo_children() if "overstrike" in task_frame.winfo_children()[0].cget("font"))
    remaining_tasks = total_tasks - done_tasks

    total_tasks_label.config(text=f"Total Tasks: {total_tasks}")
    remaining_tasks_label.config(text=f"Remaining Tasks: {remaining_tasks}")
    done_tasks_label.config(text=f"Completed Tasks: {done_tasks}")
    update_pie_chart(total_tasks, remaining_tasks, done_tasks)
- This function calculates the total completed and remaining tasks by analyzing the task frames.
Step 9: to create a pie chart
def update_pie_chart(total_tasks, remaining_tasks, done_tasks):
    for widget in pie_chart_frame.winfo_children():
        widget.destroy()

    if total_tasks == 0:
        return

    labels = ['Completed Tasks', 'Remaining Tasks']
    sizes = [done_tasks, remaining_tasks]
    colors = ['#4caf50', '#ffeb3b']

    fig, ax = plt.subplots(figsize=(5, 3), dpi=100)
    fig.patch.set_facecolor('#0d1525')

    ax.pie(sizes, colors=colors, autopct='%1.1f%%', startangle=140)
    ax.axis('equal')

    canvas_chart = FigureCanvasTkAgg(fig, master=pie_chart_frame)
    canvas_chart.draw()
    canvas_chart.get_tk_widget().pack()

    plt.close(fig)
- This function represents the number of completed and remaining tasks through a pie chart.
Step 10: Saving tasks
def save_tasks():
    with open("tasks.txt", "w") as file:
        for task_frame in task_container.winfo_children():
            task_label = task_frame.winfo_children()[0]
            task_text = task_label.cget("text").split(". ", 1)[1]
            task_done = "1" if "overstrike" in task_label.cget("font") else "0"
            file.write(f"{task_text}|{task_done}\n")
    messagebox.showinfo("Save Tasks", "Tasks have been saved successfully.")
- This function saves the tasks to a text file to reload when the app starts.
Step 11: Loading tasks
def load_tasks():
    try:
        with open("tasks.txt", "r") as file:
            for line in file:
                task_text, task_done = line.strip().split("|")
                add_task(task_text)
                if task_done == "1":
                    task_frame = task_container.winfo_children()[-1]
                    task_label = task_frame.winfo_children()[0]
                    done_button = task_frame.winfo_children()[1]
                    mark_as_done(task_label, done_button)
    except FileNotFoundError:
        pass
- By using this function, the saved tasks are loaded back into the app when they start.
Step 12: To structure the interface
canvas = tk.Canvas(newWindow, bg="#0d1525")
scrollbar = tk.Scrollbar(newWindow, orient="vertical", command=canvas.yview)
canvas.configure(yscrollcommand=scrollbar.set)

task_container = tk.Frame(canvas, bg="#0d1525")
canvas.create_window((0, 0), window=task_container, anchor="nw")

task_entry = tk.Entry(newWindow, width=35, bg="#1d2332", fg="#ffffff", font=("Helvetica", 22))
task_entry.pack(pady=10)
add_task_button = tk.Button(newWindow, text="Add Task", command=add_task, bg="#add8e6", fg="#000000", font=("Helvetica", 12))
delete_all_button = tk.Button(newWindow, text="Delete All Tasks", command=delete_all_tasks, bg="#ff6347", fg="#000000", font=("Helvetica", 12))

total_tasks_label = tk.Label(newWindow, text="Total Tasks: 0", bg="#0d1525", fg="#ffffff", font=("Helvetica", 14))
remaining_tasks_label = tk.Label(newWindow, text="Remaining Tasks: 0", bg="#0d1525", fg="#ffffff", font=("Helvetica", 14))
done_tasks_label = tk.Label(newWindow, text="Completed Tasks: 0", bg="#0d1525", fg="#ffffff", font=("Helvetica", 14))

pie_chart_frame = tk.Frame(newWindow, bg="#0d1525")
- Here, we are building the user interface.
Step 13: To run the final application
newWindow.mainloop()
- This loop keeps the window open and responsive, waiting for events.
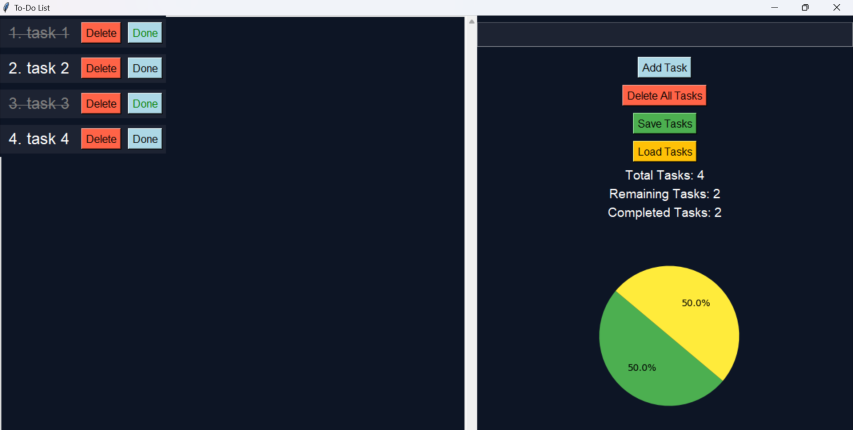
Output:
- Here is our final output:
- ( For more details refer to http://codespeedy.com )