Ads CTR Optimization using Upper Confidence Bound in Python
 ABISHEK KRISHNAPRASAD
Jul 15, 2020
ABISHEK KRISHNAPRASAD
Jul 15, 2020
Algorithm and Python Implementation for Ads CTR using Reinforcement Learning - Upper Confidence Bound Algorithm.
Online Advertising helps you select the right audience for your products, they drive effective traffic to your website and create brand awareness, these ads enables brands and companies to focus on their audience that improve both the recall and engagement. Choosing the right ad version to display in a website purely depends on the conversion rate or what is called as the Click-through-Rate (CTR) – the number of times a particular ad is clicked when a user visits a website, but it’s time-consuming if the company has many designs and versions of ads. So, we use a method of Reinforcement Learning known as the Upper Confidence Bound (UCB) for finding the ad with the highest CTR or the conversion rate.
Upper Confidence Bound:
The UCB algorithm comes under the branch of Reinforcement Learning of Machine Learning, which is a reward-based learning algorithm and it’s close to how animate objects interact and learn in a real-time environment, the problem can be traced back to the infamous Multi-Armed Bandit Problem, where resources are allocated to n-armed bandits aka slot machines and try to maximize the gain in a finite number of trials, this is a classic example of the Exploration vs. Exploitation Dilemma, in this tutorial we will learn a bit of intuition about how UCB algorithm works followed by the python implementation for finding the online ad with highest CTR given a dataset.
Upper Confidence Bound is a deterministic algorithm, it is based on optimism at times of uncertainty which brings us to this term Confidence, the level of uncertainty in a particular option means the opportunity for exploration is more, since the potential of maximizing the gain in an unexplored option is more, let’s try to understand the algorithm in an intuitive level.
Say, there are 5 versions of ads selected by a brand, a1, a2, a3, a4 and a5.
Step 1: Each ad is said to have a Confidence Interval, which includes the actual Maximum-Clicks-Rate, that is normally distributed, the Confidence Interval is a scale of optimism which is sure to have covered the unknown maximum gain in the distribution.
Step 2: Now, given the same level of confidence interval and different normal distributions for 5 ads, an ad is selected at random and is posted on a website.
Step 3: The first ad being posted, returns a reward, in this case, the result of the number of clicks on the ad, based on the proximity of the returned number-of-clicks from the actual number of clicks/maximum gain within the distribution, the confidence interval shift towards or away from the maximum gain and invariably shrinks every time a particular ad is explored and causing a shift in the value of the upper bound value.
Step 4: For the next round, the ad with the highest upper bound value is selected for exploration as the upper bound values and the confidence interval is altered after every trial iteration.
Step 5: Repeat the Steps 3 and 4 until the confidence interval’s upper bound value converges with the actual maximum gain and finally the ad with the highest upper bound value is selected to be the ad that has the maximum number of clicks.
Algorithm:
Step 1: For the number of rounds n, and for each ad i,
- Ni(n) = number of times the ad i is selected up to round n
- Ri(n) = the sum of rewards for the ad i up to round n
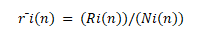
Step 2: At each round n, we compute the average reward and the confidence interval with the following formulae,
Average Reward:
Confidence Interval:
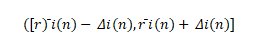 where,
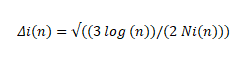
Step 3: Select the ad i with the maximum UCB value, i.e. 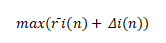
About the Dataset:
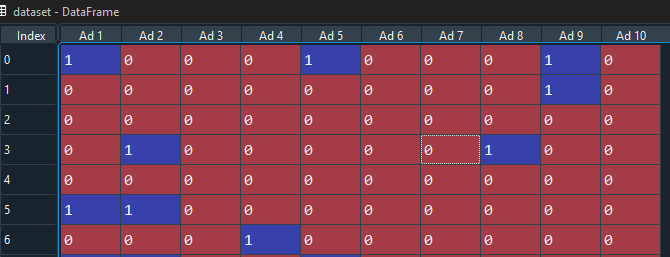
The Dataset we’re going to work with for implementing the UCB algorithm is a .csv extension file (comma separated values), containing 10k entries of visitors in a website for 10 different versions of ads, it contains 0’s and 1’s. 0 if a user doesn’t click on an ad and 1 if the user clicks on the ad, though the actual algorithm works well on a real time basis, we use this dataset for the purpose of understanding the implementation and the working of the algorithm.
The link for the dataset: Ads-Dataset
Python Implementation:
#Importing the essential python libraries
import numpy as np
import pandas as pd
import matplotlib.pyplot as plt
The above Python libraries are widely used for processing datasets, working with n-dimensional arrays and for plotting and visualizing the results.
Next, we import the dataset with extension .csv from a special method from pandas framework, pd.read_csv
#Importing the dataset
dataset = pd.read_csv('Ads_CTR_Optimisation.csv')
The .csv file is now imported as pandas Dataframe, which can be used to visualize and process the data more effectively, the next step is implementing the UCB algorithm, we also import a special library for math operations such as square root and log functions within the algorithm called math.
#Implementation of the UCB Algorithm
import math
N = 10000
d = 10
no_ads_selected = []
numbers_of_selections = [0]*d #creates a list of 10 zeroes
sum_of_rewards = [0]*d
total_reward = 0
for n in range(0, N):
    ad = 0
    max_ub = 0
    for i in range(0, d):
        if (numbers_of_selections[i] > 0):
            average_reward = sum_of_rewards[i] / numbers_of_selections[i]
            del_i = math.sqrt(3/2 * math.log(n + 1) / numbers_of_selections[i])
            upper_bound = average_reward + del_i
        else:
            upper_bound = 1e400   #we set the upper bound to a very large value to make sure every ad is selected
        if upper_bound > max_ub:
            max_ub = upper_bound
            ad = i
    no_ads_selected.append(ad)
    numbers_of_selections[ad] = numbers_of_selections[ad] + 1
    reward = dataset.values[n, ad]
    sum_of_rewards[ad] = sum_of_rewards[ad] + reward
    total_reward = total_reward + reward
This code implements the UCB algorithm, the next step is to visualize the results of the ads CTR, we plot a histogram to view the ad with the highest conversion rate by using the python's matplot library.
# Visualising the results
plt.hist(no_ads_selected) #to plot a histogram
plt.title('Ads Selection CTR')
plt.xlabel('Ads')
plt.ylabel('Number of selections - ads')
plt.show()
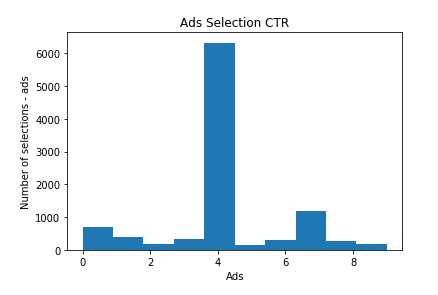
By Visualizing the graph, it is evident that the algorithm finds the almost accurate prediction of the conversion rate and now the company can be sure to select the best CTR version of ad for the website, I hope you found this implementation helpful and gained an intuitive understanding on the concept of reinforcement learning and it's efficacy in predictions and explorative analysis.
Project Files
| .. | ||
| This directory is empty. | ||
