CMPM Analytics using Python
 Rachit Singh
Jul 09, 2023
Rachit Singh
Jul 09, 2023
This Project is a Streamlit web app that calculates Beta and Returns for selected stocks using the Capital Market Pricing Model (CMPM).
Introduction:
The CMPM is a method for calculating the expected return on investment. It takes into account two factors: the investment's risk and the overall market performance. Riskier investments, according to CMPM, should have greater expected returns. It employs a metric known as "Beta" to analyse how much an investment moves in comparison to the market. A greater Beta indicates that an investment is more vulnerable to market changes. CAPM assists investors in determining if an investment is worthwhile by comparing its expected return to that of a risk-free asset, such as government bonds.
It indicates that the expected return on a security is equal to the risk-free return plus a risk premium (rm – rf).
ri = rf + Bi (rm – rf)
ri = Expected return on a security
rf = Risk free rate of return
Bi = Beta between the stock and the market
rm = Expected return of the market
Risk Free Asset Return
The expected return or profit we can get from investing in an asset that is considered to be entirely risk-free and safe. This implies that investing in this asset has a zero risk of losing your money.
The risk-free asset return is used as a benchmark or baseline in the CMPM to compare the returns of different investments. It can be used to calculate the expected return on a risky investment. To compensate for the added risk, the return on a risky investment should be larger than the risk-free rate, according to the CMPM.
Example: Assume that you have Rs 5,000 and are considering where to invest it. One possibility is to invest money in a government bond, which is regarded as a risk-free asset. Assume the government bond provides a 5% yield.
Let's imagine you have another investment opportunities, such as buying a stock. This stock is riskier, which means you might lose part or all of your money. To compensate for this risk, the stock would need to return 10% more than the risk-free asset.
As a starting point, the risk-free asset return (5%) is used. It states that if you invest in a government bond, you can make 5% without taking any risks. If the stock asks you to take on more risk, it must provide a bigger return (10%) to be profitable.
Market Portfolio Return
In the CMPM, the Market Portfolio return refers to the average return of all investments in the whole market. It indicates the aggregate performance of all accessible assets for investment.
To grasp this idea, consider a market with only two assets: stocks of Company A and stocks of Company B. Company A is regarded as riskier, whilst Company B is regarded as less risky.
Example: Assume the expected return on Company A's stock is 15% and the expected return on Company B's stock is 8%. The market valuations of the two equities in the market portfolio determine their weights. Assume Company A's stock is worth $1,000 and Company B's stock is worth $2,000 on the market.
The Market Portfolio return is calculated by taking the weighted average of the returns on the two equities based on their market valuations. In this scenario, Company A's stock weight is 1,000 / (1,000 + 2,000) = 1/3, and Company B's stock weight is 2,000 / (1,000 + 2,000) = 2/3.
As a result, the Market Portfolio return is (1/3 * 15%) + (2/3 * 8%) = 9.67%. This means that if you invested in the whole market portfolio, you could expect a 9.67% average return.
The Market Portfolio return is critical in CMPM because it serves as the benchmark against which individual asset projected returns are measured. Assets having greater projected returns than the Market Portfolio are thought to be riskier, whereas assets with lower expected returns are thought to be less risky. The CMPM assists investors in determining whether the expected return on an asset is appropriate considering its level of risk in comparison to the Market Portfolio.
Beta
In the framework of the Capital Market Pricing Model (CMPM), Beta measures an individual stock's or investment's sensitivity to shifts in the wider market. It assists us in determining how much a specific stock's price is expected to move in relation to the larger market.
Assume you're thinking about investing in two separate stocks: Stock A and Stock B. The Beta of Stock A is 1.2, while the Beta of Stock B is 0.8. If the market, as represented by an index such as the S&P 500, rises by 10%, Stock A should rise by 1.2 times that amount, or 12%. Stock B, on the other hand, would most likely move 0.8 times the market, or 8%.
So, if the market rises by 10%, Stock A is predicted to rise by 12%, while Stock B is expected to rise by 8%. The Beta helps us understand how volatile each stock is in comparison to the general market. A Beta greater than one implies that the stock is more volatile than the market, whilst a Beta less than one indicates that the stock is less volatile. A beta of one indicates that the stock moves in lockstep with the market. We may analyse the risk and expected return of an investment based on its sensitivity to market fluctuations by introducing Beta into the CMPM.
S&P 500
The Standard & Poor's 500 Index is referred to as S&P500. It is a stock market index that gauges the performance of 500 significant American firms that are listed publicly. A common gauge for the overall performance of the American stock market is the index.
If we use the symbol 'sp500' while requesting data using yfinance, we can get historical price information for the S&P 500 index. This information covers each trading day's volume and adjusted closing price in addition to the high, low, opening, and closing prices.
Objective:
The aim of this CMPM Analytics project is to create an interactive online application in Streamlit that allows users to analyse and calculate the beta and return for specific stocks using the Capital Market Pricing Model (CMPM). The project's goal is to give users information about the risk and potential returns of their chosen equities.
Implementation:
(i) The page title, icon, and layout for the Streamlit app are set using the st.set_page_config() method.
(ii) Formatting the Page: The st.write() function in the code contains a CSS style block that applies a unique font style (Orbitron) to the entire page.
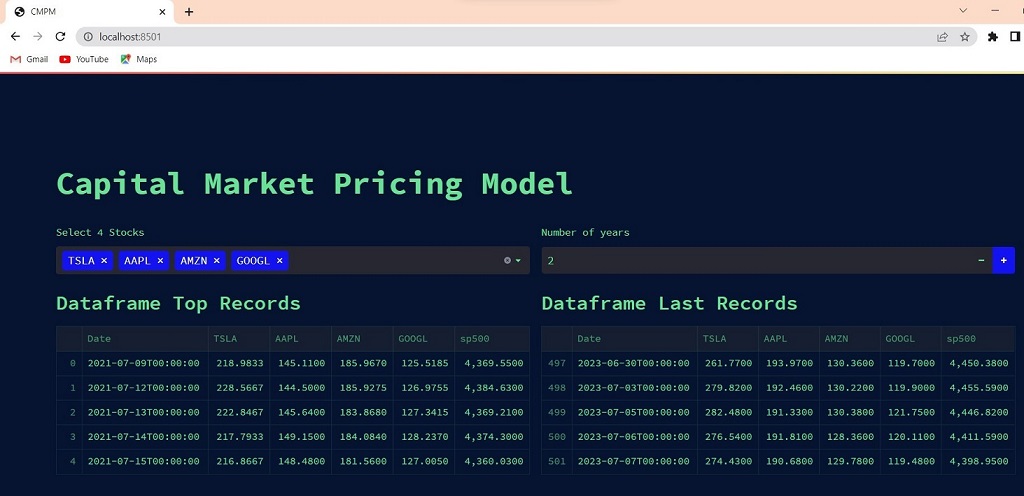
(iii) User Input and App Layout: The application creates two columns for user input using Streamlit's st.columns() API. The user may pick up to four stocks from a multiselect dropdown to display in the first column (col1). The user can enter the number of years for the analysis in the second column (col2).
(iv) Acquisition and processing of data: S&P 500 market data is downloaded using pandas_datareader module's web.DataReader() function. It build an empty DataFrame (stocks_df) and uses the yf.download() function to obtain historical stock data for the chosen stocks as it iterates over the DataFrame. The S&P 500 data is combined with the retrieved stock data and placed in the stocks_df DataFrame. Additionally, the code formats and converts several data types for the DataFrame.
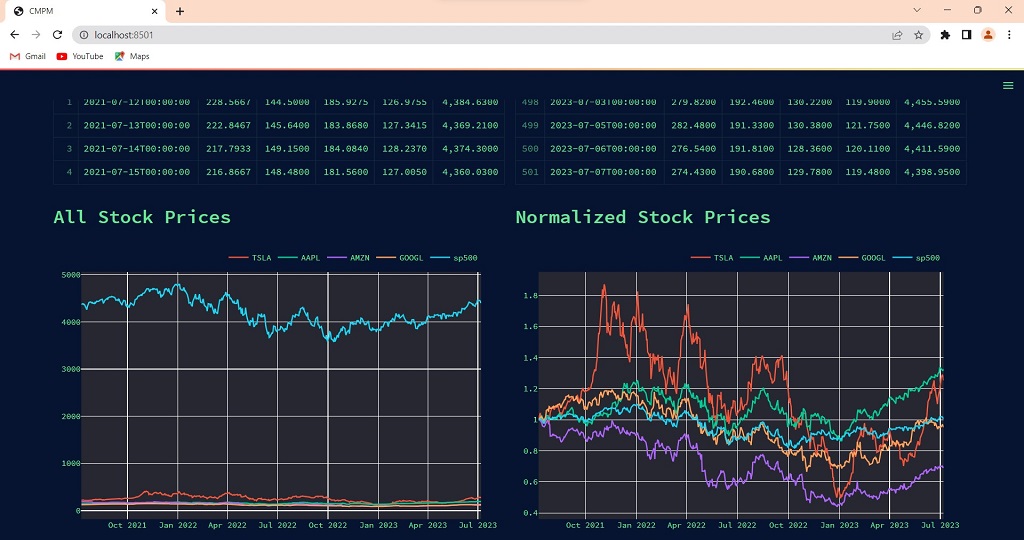
(v)Data Display: The app uses the st.dataframe() function to show the first and end rows of the DataFrame. st.plotly_chart() produces and displays two plots: All stock prices are depicted in the first plot across time. Normalised stock prices are displayed in the second plot.
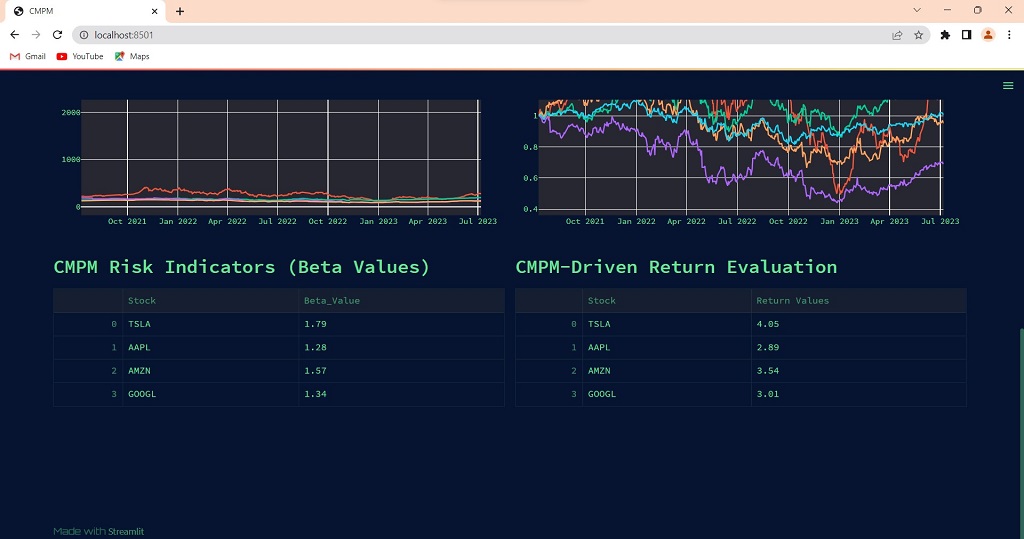
(vi) CMPM Calculations: The daily returns, beta, and alpha for each chosen stock are computed using the CMPM_Utilities module. Dictionaries (betas and alphas) are used to store the calculated betas and alphas. st.dataframe() is used to display the betas in a DataFrame. The market portfolio return (Rm) is calculated by the code, and it is then used to determine the CMPM-driven return for each stock. Using st.dataframe(), the CMPM-driven return values are shown in a DataFrame.
Utility functions for calculations:
(a) interactive_plot(df): This function generates an interactive plot using the Plotly library (plotly.express). It accepts a DataFrame (df) as input and outputs a line chart with the date on the x-axis and stock values on the y-axis. It loops over the columns of the DataFrame to plot the data for each stock. The created figure is returned by the function.
(b) normalize(orig_df): This utility function normalises stock prices depending on their initial values. It takes an original DataFrame (orig_df) and generates a copy (df). It divides the values in each column (stock) in the DataFrame by the first value in that column. This assures that all stock prices begin at one. The normalised DataFrame is returned by the function.
(c) everyday_return_percent(df): This function computes the daily returns for each stock in the DataFrame (df). It copies the DataFrame (df_everyday_return). It estimates the percentage change between consecutive values for each column (stock) in the DataFrame and multiplies it by 100 to get the % return. Because there is no preceding value to calculate the return, the function sets the first value of each column to 0. The function returns a DataFrame that contains the daily return values.
(d) beta_computation(stocks_everyday_return, stock): The beta coefficient for a stock is calculated using the daily returns of the stock and the S&P 500 index. It accepts as input the DataFrame of daily returns (stocks_everyday_return) and the name of the stock (stock). It computes the S&P 500 index's mean return (Rm) multiplied by 252 (the number of trading days in a year). It then runs a linear regression (np.polyfit) on the S&P 500 returns and stock returns to calculate the beta coefficient () and alpha coefficient (). The beta and alpha values are returned by the function.
Results/ Outputs:
Conclusion:
The Project is an interactive web application created with Streamlit that is implemented using the provided code. The Capital Market Pricing Model is used to analyse and compute the Beta and Return for particular equities. It offers a number of interactive elements, including the ability to choose a stock, specify the number of years to be analysed, and view stock prices.
Project Files
| .. | ||
| This directory is empty. | ||
