Linear Regression using Python
 Adarsh Hiremath
Sep 30, 2020
Adarsh Hiremath
Sep 30, 2020
Implementing Linear Regression with Python using different libraries like Seaborn, NumPy, Scikit-learn, and TuriCreate. In the end, building a Linear Regression Model from scratch.
In this Python project, we will create a Linear Regression Model to predict house pricing from the given dataset for the respective implementations.
Linear Regression
Linear Regression is a manner in which there is an attempt to establish a relationship between two variables in which one of them is a dependent variable and the other one is independent. In this, the modeling of the relationship is being implemented to determine the independent variables in a relationship with the dependent variable.
According to Calculus, if this had to be presented in an equation form it could be written as −
Y=mX+c
So, we can figure out that
Y is what we are trying to find, which is the dependent variable.
X is the independent variable which is used to make the determination.
The gradient of the regression line is represented by m which depicts what effect Y is having by X.
c is known as the intercept constant, Y-intercept. When X is zero, Y = c. This means that c is the value Y will hold when there is no effect of X on Y.
Residual Sum of Squares
The Residual Sum of Squares is the concept used in the determination of right and a tight fit for the given set of points. In this, the Sum of the Squares of the distances from the points onto the line is determined. This is called the Residual Sum of Squares or it is also known as the sum of the squared estimate of errors. The plot of the regression line with the least RSS is said to be a tight fit for the model.
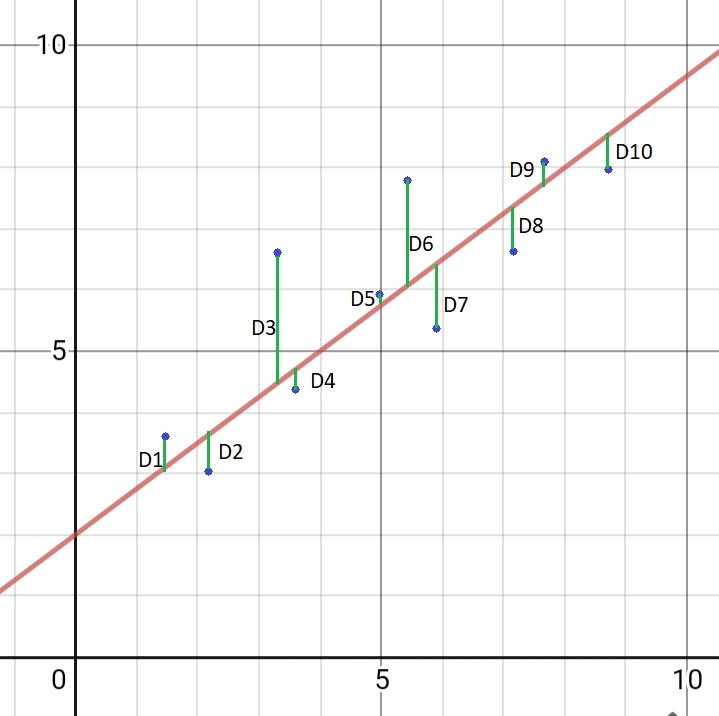
We are labeling each green line as having a distance D, and each blue point as having a coordinate of (X, Y). Then we can define our best fit line as the line having the property :
D = D12+D22+D32+D42+....+D102
When D is least, that is when RSS is said to be minimum, hence it will be a tight fit.
All the further required explanation is provided within the Ipython notebook.
Libraries That will be needed:
- Seaborn
- Scikit-Learn
- NumPy
- Pandas
- TuriCreate
Seaborn will be used to visualize the data we have and to get a much better understanding of the dataset. Will also use it to get an idea of how it would look when a line is fitted. Pandas will be used to load the data into DataFrames so that accessing them and working on them becomes much easier. NumPy will be used to fit the data and using the predefined function this will be accomplished. Scikit-learn and TuriCreate will be used to fit the data with a much better fit and using the concept of RSS.
To install these, go to your command window/terminal and type the following commands:
pip install scikit-learn
pip install numpy
pip install pandas
pip install seaborn
pip install matplotlib
pip install turicreate
DataSets:
- Dataset for Scikit-learn is imported from sklearn.datasets.
- Datasets for Turicreate and the model built is attached in the zip file.
Project Files
| .. | ||
| This directory is empty. | ||
